Objective
In this course, attendees will learn how to use debugging tools and techniques to fix bugs and performance issues in the Android operating system.
Detailed agenda
- Introduction to software debugging: the step-by-step debugging process, the importance of understanding the problem and identifying the steps to reproduce it, the 5 types of problems (crash, hang, logic/implementation, resource leakage, performance), debugging techniques and tools (knowledge, log analysis, tracing/profiling, interactive debugging, debugging frameworks), development environment.
- Introduction to LLDB: the LLVM project and LLDB, starting the debugging process with LLDB, command line interface, controlling the execution, working with breakpoints and watchpoints, printing variables and the stack backtrace), integration with Visual Studio Code, tips and references.
- Native layer debugging: introduction to the Android native layer, log management on Linux systems, log management on Android, logd (log daemon) and logcat, core dump analysis on Android, tombstone analysis, resolving symbols with addr2line and LLDB, the development/scripts/stack helper script, debuggerd program, crasher tool, code protections (FORTIFY, -fstack-protector, AddressSanitizer, etc).
- Native layer tracing: advantages of using tracing tools, introduction to strace, the ltrace tool, tracing the kernel with ftrace, instrumenting Android with atrace and systrace, tracing user space code with uprobe.
- Native layer interactive debugging: debugging native applications on Android with LLDB, remote debugging architecture, debugging a running application, loading symbols into LLDB, compiler optimizations, the lldbclient.py script, debugging crashes with LLDB, debugging multithreaded applications, integrating and debugging native applications on Android with Visual Studio Code.
- Debugging memory usage in the native layer: main errors related to memory usage (invalid access, buffer overflow, use after free, double free, memory leak, etc), introduction to memory leak, collecting information about the memory usage (free, vmstat, top, procrank, librank, pmap, showmap, dumpsys, etc), instrumenting memory usage with Malloc Debug, using the libmemunreachable memory leak detection library, identifying memory leaks with heapprofd and Perfetto, implementing memory allocation hook routines with Malloc Hooks.
- Framework debugging: introduction to the Android framework, framework debugging techniques and tools, debugging the framework via log messages, the system and events log buffers, debugging the framework with the dumpsys tool, collecting debugging information via bugreports, useful command line tools for debugging (am, pm, wm, input, cmd, service, etc), analyzing crashes in Java/Kotlin code, analyzing ANR errors, interactive debugging architecture in the ART virtual machine, debugging framework services and applications with Android Studio, generating Android Studio project files with the aidegen script, introduction to the Android Studio for Platform (ASfP) project, “Developer options” menu and “Dev Tools” application.
- Performance analysis: introduction to performance problems, definition of tracing and profiling, performance analysis techniques and tools, the systrace tool, the “System Tracing” menu, the Perfetto performance analysis framework, CPU profiling, analyzing performance with the simpleperf tool, CPU profiling with Perfetto, memory profiling, inspecting memory usage with dumpsys, instrumenting memory usage with the heapprofd tool, power consumption analysis, collecting information about power consumption with the batterystats service, the Battery Historian tool, Android Studio’s Power Profiler functionality, boot time analysis, bootchart, analyzing boot time with simpleperf, tips on profiling Android applications.
- Final considerations: additional links and resources, book recommendations, questions and final comments, closing.
For more details on the content of this training, you can download the agenda and the slides (in Portuguese).
Additional information
Students, engineers and software developers interested in studying Android operating system debugging tools and techniques.
User of GNU/Linux distributions, experience with the Linux command-line interface (ls, cp, mv, cat, grep, find, vi, tar, etc), intermediate knowledge of C, C++ and Java, architecture and components of the Android operating system, knowledge of the AOSP and the Android build system.
The course material contains the slides of the presentations, the book of activities and exercises, reference guides, and additional reference documents. All materials will be provided in an electronic format at the start of the training session.
This training does not require any development kits or additional hardware, since the Android emulator (Cuttlefish) is used during the exercises. If required by the contracting company, the training can be ported to other hardware platforms.
The training can be presented in the following languages: Brazilian Portuguese and English.
If you plan to train your team or a group of people, consider a training session inside your company. In an in-company training session, the company is responsible for providing the necessary resources needed for the training, including the training room, data projector and development machines. This model also brings big advantages for the company, since the cost of transportation and accommodation of several employees is reduced only to the instructor. If your company has a special requirement, we can study a program that meets your needs, like preparing the training material for a specific hardware platform or developing additional content. Don’t hesitate to get in touch via email or the contact page .
Open training sessions are presented in a pleasant environment, with a properly equipped laboratory and Internet access. Classes are usually presented full-time, with a stop for lunch and a coffee break in the morning. If you are interested in attending an open session but there are no classes available, send a message via the contact page and we will notify you as soon as new classes open.
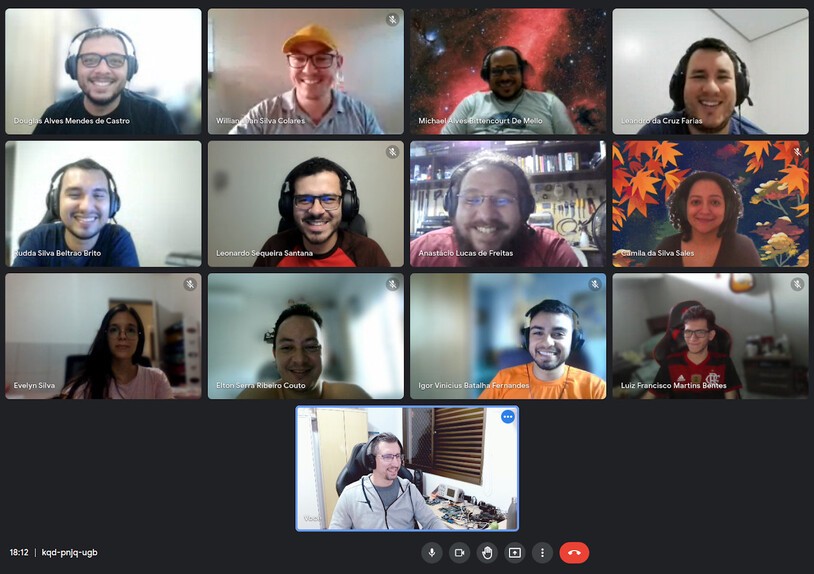
This training can be executed in a remote/online environment. Online training is presented live on a virtual meeting platform like Google Meet or Zoom.
Photos gallery
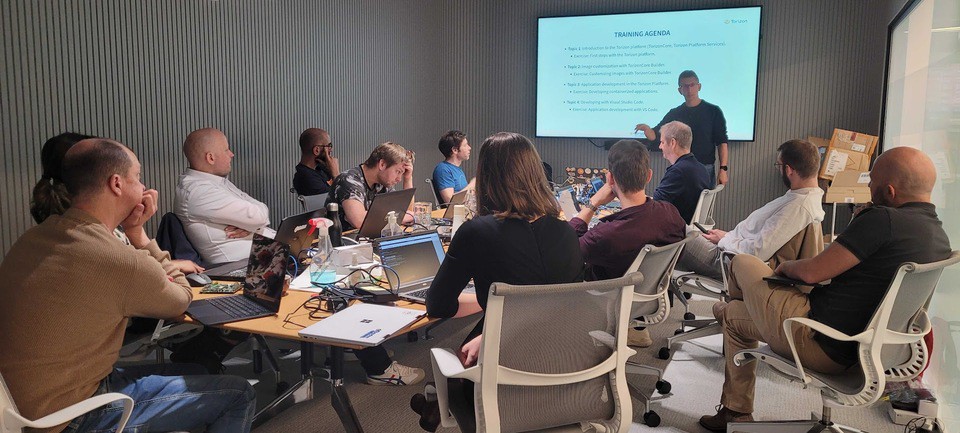
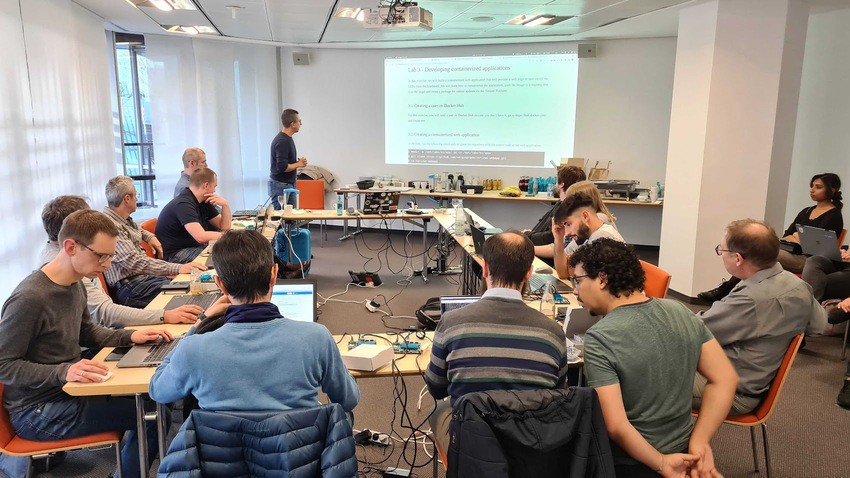
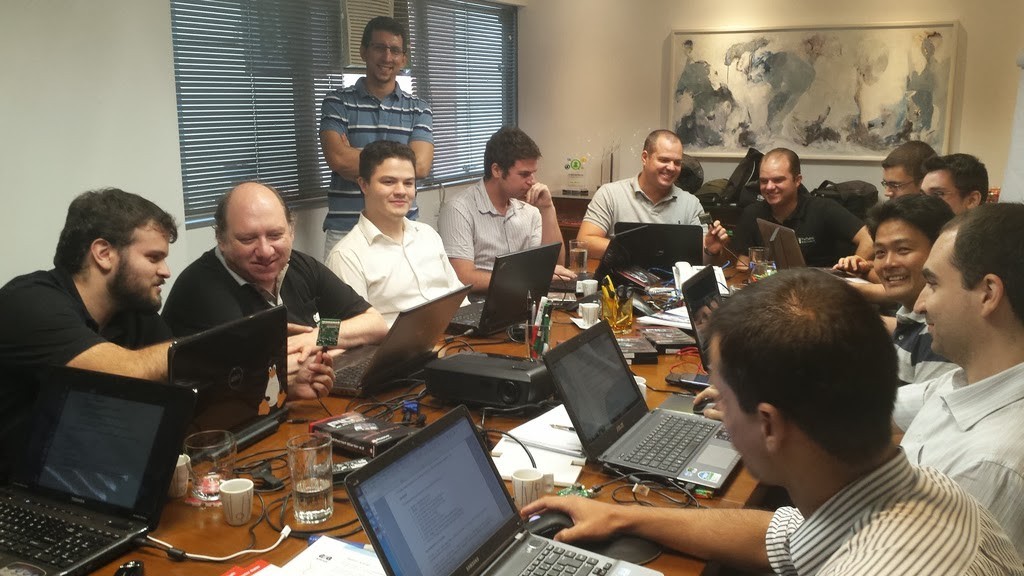
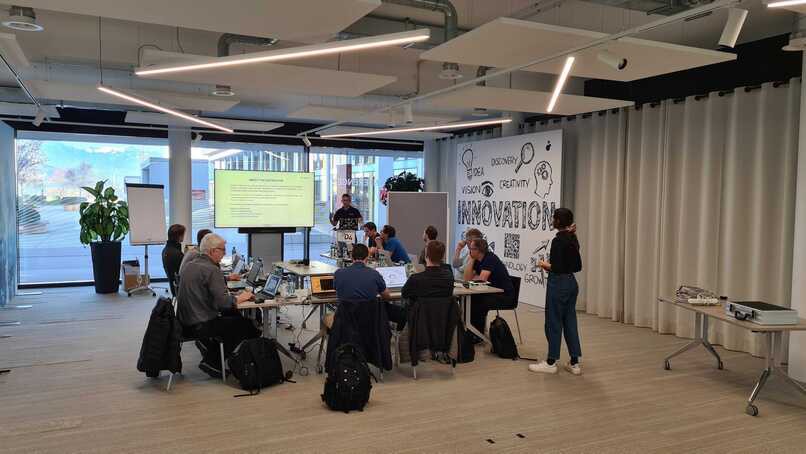
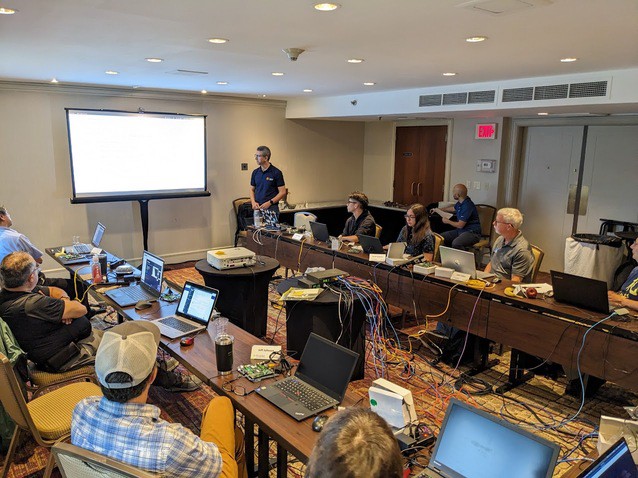
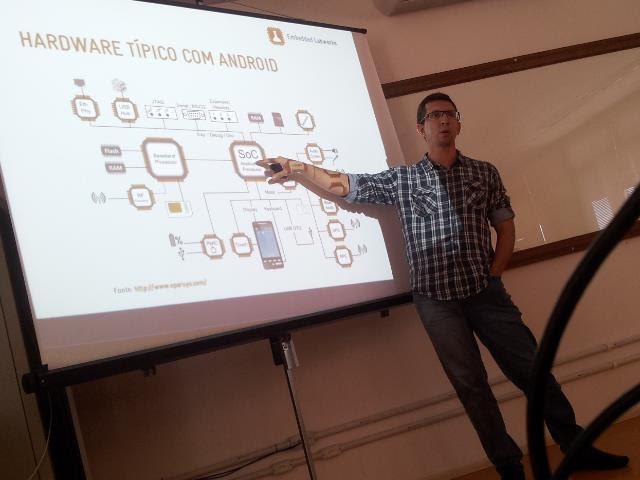
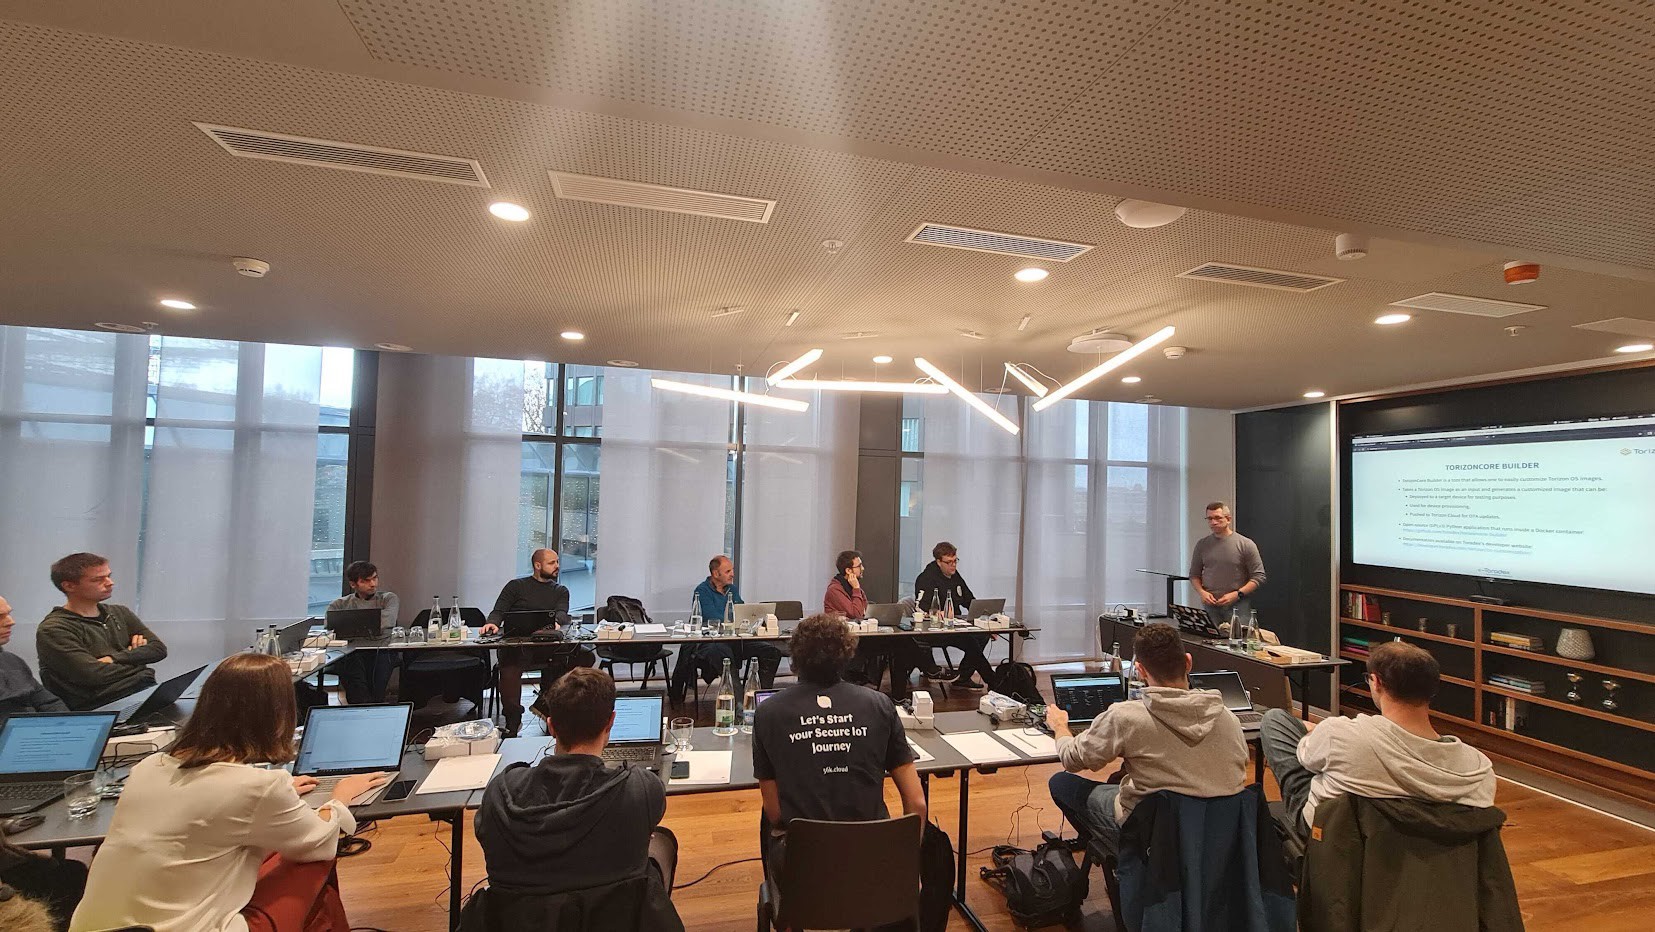
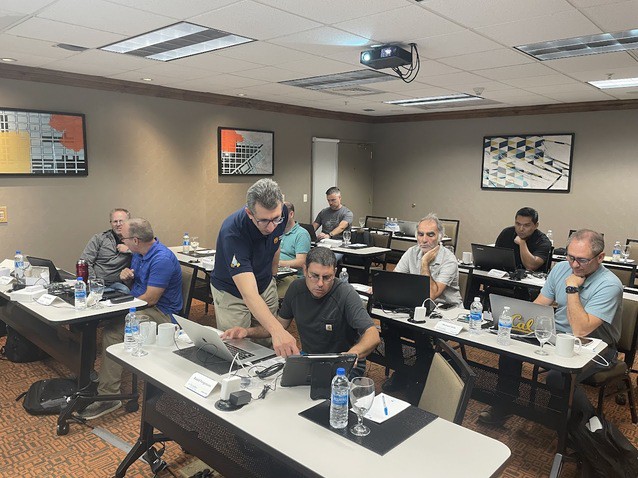
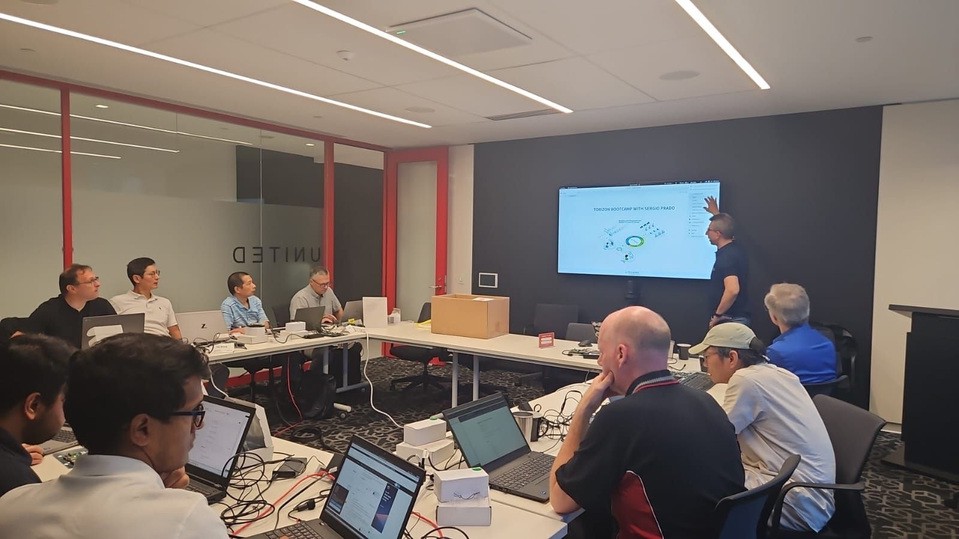
Some pictures from previous training sessions:
